I've been looking for a better way to keep track of my family finances, but - being the picky person I am - I've been having trouble finding one that meets all my needs. Obviously, my software developer mindset keeps telling me to make my own solution, but also, when it comes to my money and spending habits, I am even more privacy-obsessed than usual.
What We've Been Doing
Usually, my wife and I look over our finances at least monthly. The idea is just to be able to track where and when my money is coming into my possession, where and when it is leaving, and then using that information to plan for the future (ie: budget). What we had been doing up until now was using a Google Sheet to track categories of spending. On the second Monday of every month, the two of us would sit down, and review our incomes and expenditures of the past month. We would categorize each transaction, and type in the amount in the appropriate cell. So, for example, if I ate out for lunch, we would type in "personal - brandon: $10.27". Because most categories would have more than one transaction in it, instead of a simple value, we would type in a calculation in the formula bar - "= 10.27 + 5.77 + 12.99" - and the spreadsheet gives the total.
Yes, all the numbers in the images are made up.
This process worked, in that it gave us a bird's-eye view of where our money was coming from, and where it was going, as well as whether we ended the month in the red or in the black. It being a spreadsheet, I could also customize it as we wanted. I could add or remove categories, add derived values (like sums or averages), and highlight certain data that I felt was important. There were some problems, however.
The biggest one was that, with this spreadsheet, we did not track individual transactions, only categories. This gave us a general view, but no detailed information. This also meant that we had to wait until a month was over (and at least a few days after that) before considering the expenditures for that month. This is because it's difficult to add to a dozen or so cells, each with their own little summation formula, days later. It was also near impossible to find errors (like typos), let alone fix them, without redoing the whole month.
There were also a lot of recurring transactions, such as rent and utilities, that we had to type in with all the rest. They have the same payee, and often, the same amount, every month. It was annoying to type it in over and over again. This is a prime candidate for automation.
Finally, although this system dealt with subtotals, and not details, I was still wary of feeding personal financial information into the Google machine (my love for them notwithstanding).
A New Solution
This is what I needed:
- I did not want to give details of my financial transactions to a third party.
- I wanted to be able to customize it as I wish.
- It had to be quick and easy to use on a regular basis.
- Ideally, it would help avoid unnecessary repetitive work.
- It had to allow us to see in detail and in general how we're spending our money, and give us an idea of how well we're doing.
- Preferably, it had to be free.
I should note here that my bank had a tool similar to what I wanted (which I considered). It presented all my transactions in a pretty format with pie charts and everything. Plus, it was not sending our data to a third party (at least, I hope not), since it is the "second party". However, it categorized a lot of our transactions incorrectly, and it was impossible to customize.
Most solutions I looked at didn't meet especially the first and last of my requirements. I know some online services offer good features like planning tools and money advice, but beyond that, I have no idea why anyone would pay a recurring fee to give their sensitive data to some big company, just to do what a very simple spreadsheet does. Some other services try to make things more convenient by requesting direct access to your bank account in order to pull data from it. Stuff like that just creeps me right out.
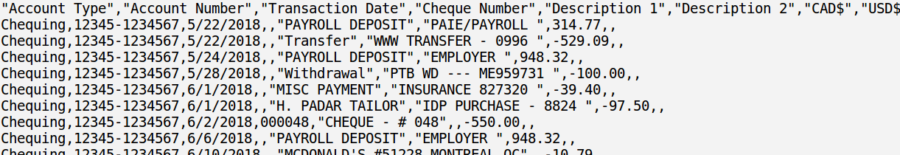
That said, it's still rather tedious to copy and paste, or manually type in, all details about every transaction into some program. Fortunately, my bank provides the key to my solution. For a number of years (I'm not sure how long), they have offered an option to download an electronic copy of all my recent transactions in a comma-separated values format.
I knew I could use this, but I wasn't sure of the optimal way. I started considering my options.
Being a web developer, I thought I could make a web app that parsed the file, saved the data to a database, and presented the data in a pretty frontend. I'm embarrassed to report that it took almost ten full minutes to realize that this idea was insanity. From the overkill of the storage, to literally reinventing spreadsheet software just as a glorified table. It did seem like fun for a moment, but it's definitely not worth the effort.
I thought of simply using the csv text file directly, or importing it to a spreadsheet. This was rather unwieldy. There were a lot of repeated records (that's partly my fault, to make sure I didn't lose anything), unnecessary fields, and it's sorted by account instead of by date. Spreadsheets can deal with all of this, but it adds processing work every time I import a file (pasting to a separate sheet, deleting columns, sorting, etc).
How It Works
What I settled on is a pre-processing script written in bash, in conjunction with a rather simple spreadsheet.
Every month - or as often as I want - I will download all my transactions in a csv file from my bank. I will put the file into a designated folder, and run the bash script. The script parses the file, then moves it into an archived backups folder. It also copies the results into the clipboard, which I then paste into my spreadsheet, and the spreadsheet automatically generates a summary.
The Pre-Processing Script
The heart of the bash script is a single command with a couple seds.
# Part 1 of 3

# find new statements, extract new records
for i in $csv_folder/*.csv
do
    basename $i # display current file
    cat $csv_folder/archive/*.csv | # gather all previous statements
        grep -xFvf - $i | # remove duplicates
        sed 's_\r__g' | # remove carriage returns
        sed 's_^\([^,]\+,[^,]\+\),\([^/]\+\)/\([^/]\+\)/\([^,]\+\)_\4-\2-\3,\1_g' | # move date to front
        sed 's_^\([^,]\+\),\([^,]\+\),[^,]\+,_\1,\2,_g' >> /tmp/isolated # remove account number
    mv $i $csv_folder/archive/
done
First, there is a for-loop going over every csv file in the folder that is not in the archive folder - usually, there would only be one.
Then, the cat $csv_folder/archive/*.csv collects all the csv files from the archive folder in order to check for duplicates. The bank offers two options: either download every transaction on file (going back a couple months), or only download the new transactions since the last download. The second option would prevent duplicates, but I prefer the safety of the overlap to make sure no transaction is omitted (due for example to a lost file).
The grep -xFvf - $i, in a stroke of cleverness (which I owe to this answer on Stack Overflow), takes all the lines from all the archived files (compiled by the previous statement), and removes them from the search results of parsing the new file. This outputs only lines that were unique to this file (effectively finding the difference).
Then it removes the carriage return characters via sed 's_\r__g'. This is important for the next two steps.
The next sed parses the csv file and moves the date from the third position to the first. This is to make it easy to sort by date later on, and ensure that the date is in the first column in the spreadsheet. The last sed removes the account number, since it is rather sensitive and repetitive data, and since it takes up unnecessary space in the spreadsheet.
Finally, the loop moves the new file into the archived backups folder.
The second part of the script pre-categorizes recurring transactions. For example, if the payee is the name of our internet provider, the script will automatically add "internet" in the last field. If the payer is the name of my employer, the script will add "brandon-job" in the last field.
# Part 2 of 3

# label common records

sed -i '/ULTRAMAR/ s_$_"gas",""_' /tmp/isolated
sed -i '/ESSO / s_$_"gas",""_' /tmp/isolated
sed -i '/PARKING/ s_$_"car parking",""_' /tmp/isolated
sed -i '/IGA / s_$_"groceries",""_' /tmp/isolated
...
The third and final part of the script is to sort the results, and copy them to the clipboard using xclip.
# Part 3 of 3

# sort by date
sort -t "-" -k1n -k2n -k3n /tmp/isolated > /tmp/iso-sorted

# print results
echo "---"
cat /tmp/iso-sorted
echo "---"

# copy results to clipboard
xclip -selection clipboard -in /tmp/iso-sorted

echo done
There is a lot in this script that can be optimized, but it works well for now, so I'll get to it when I get to it.
The Spreadsheet
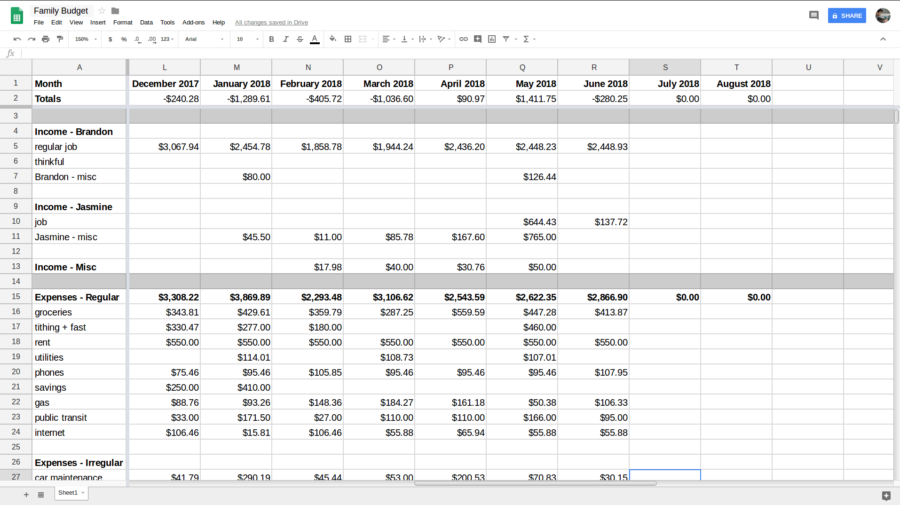
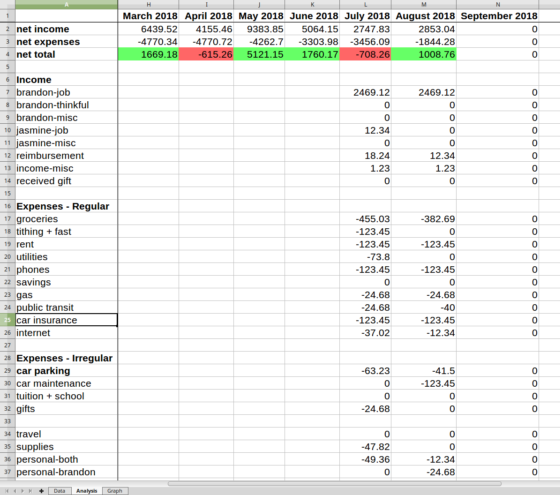
The spreadsheet itself is stupid simple. There are three sheets - two, if you leave out the one that the graphs sit on - and a total of four formulas, two of which are more for show.
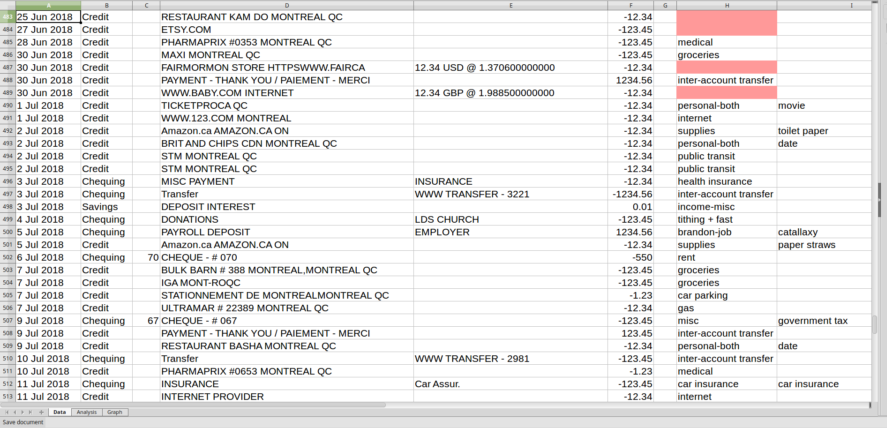
On the Data sheet, I paste in the results from the processing script. There are columns for the date, the account type, the payee (or payer), a description, and an amount - these came from the csv. There are two extra columns that I added: the first is the category (many of which were pre-populated by the script), and the second is for notes. In the notes column, we write in a couple words to remind us what that purchase was for. As an example, if we buy something from Amazon, it will tell us the amount and the date that the transaction cleared, but not what it was that we bought. So we write that in. This column is completely optional.
The Analysis sheet takes the information from the Data sheet, and gives totals of each category for the month, as well as a net total. The formulas here are simply to sum the values from the amount column where the header column matches the month requested.
In order to make it very convenient, I had to learn about the SUMPRODUCT function (which I, again, found on Stack Overflow). As an example, the formula to display all the incomes for one month is:
=SUMPRODUCT(MONTH(Data.$A:$A) = MONTH(B$1), YEAR(Data.$A:$A) = YEAR(B$1), Data.$F:$F > 0, Data.$F:$F)
The month "August 2018" is in cell B1, the transaction dates are on the Data sheet in column A, and the amounts in column F. SUMPRODUCT does a cross product over the arrays in the arguments. The MONTH function gives a number from 1 to 12 for the month of a cell; similarly with the YEAR function. If the month (or year) is equal to the requested month, then it returns a 1, otherwise a 0. Here, I'm requesting all amounts that are greater than zero. Finally, the cross product with a bunch of ones, zeroes, and amounts, gives me the sum of all the amounts of the appropriate month, greater than zero. I repeated this with amounts less than zero (expenses), net total, and for each category.
Because the formula in each cell is summing conditionally across all my data, it's somewhat slow. However, the benefit is that I don't have to create a new formula for each cell, and I can simply fill across for each new month in one go. I'll keep looking for an improvement here, but when going over family expenses one at a time, processing speed is not the highest priority.
As a finishing touch, I added conditional formatting to highlight certain trends - like when our total expenses for the month exceed our incomes (hopefully that doesn't happen too often!). A graph or two - just for fun - and that's it!
Conclusion
Surprisingly, I hit all of my requirements. Plus, the work-to-reward ratio was ideal. The whole thing was done in one morning, with some improvements and tweaks the next day. So far, I like it!
Correction - 5 Sept 2018
I previously wrote that the spreadsheet function SUMPRODUCT gives the cross product of the arrays in the arguments. Because it gives a single number as a result, what I said was incorrect. It would probably be more analogous with the dot product, which takes arrays and yields scalars, when applied to single-dimensional arrays of the same size (which mine does). Actually, "Frobenius inner product" is the precise mathematical function. More information can be found on here, making this the third reference to Stack Overflow in this article! More on SUMPRODUCT in a future post.